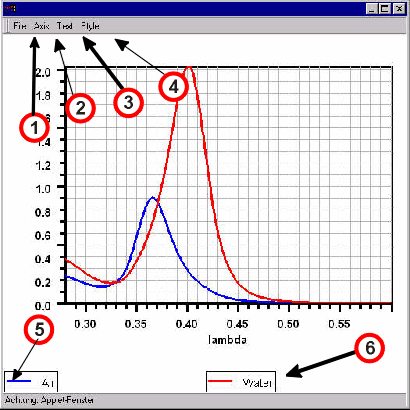
File menu. All but the last menu items are disabled in the internet version.
Menu items:
Print -- print content of plot window.
Convert to .eps -- convert plot to encapsulated postscript
format (has not been checked on all platforms. On Windows it works beautifully
together with CorelDraw7, Ghostview, and LaTeX)
Save ASCII -- save result as a table in ASCII format. This feature
is very convenient, if you wish to process the data using another program.
View ASCII. -- view data in ASCII format.
Axis menu. Menu items:
lin y-axis -- select this item to use a linear scaling of the
y-axis (default)
log y-axis -- logarithmic scaling of the y-axis
lin x-axis -- linear scaling of the x-axis (default)
log x-axis -- logarithmic scaling of the x-axis
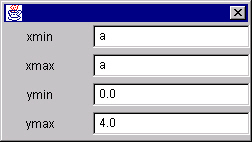
xy-bounds -- select this item to open the following dialog:
xmin/xmax is the smallest/largest value to be displayed on the x-axis.
ymin/ymax is the smallest/largest value to be displayed on the y-axis.
The symbolic value "a" means that the bounds shall be calculated automatically
from the data (default)
Text menu. Menu items:
Title -- select title of plot ("Silver particle r= 50 nm" in the previous
example)
x-title -- select title of x-axis ("wavelength [micron]" in the previous
example)
y-title -- select title of y-axis("Q" in the previous example).
Style menu. Menu items
no grid -- don't plot a grid
coarse grid - plot a coarse grid
fine grid - plot a fine grid
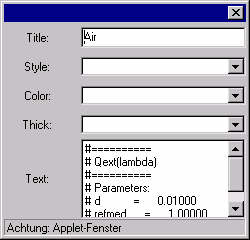
Label button for the first curve -- click on this button to open the following
dialog:
In the first line of this dialog, you may edit the label's text. Use
the select boxes to change the style (solid,dashed, dotted, etc.), color
and line thickness of the curve. The Text field contains some descriptive
text of the curve. This information is stored on file if you choose the
File->Save ASCII menu item.
Label button for the second curve -- for each curve, a label button is
displayed, so that you easily can modify the appearance of the curves.