| <<<< BACK |
|---|
You may use cut and paste to copy these data into the program's text area. However, the program does not yet know how to interpret the data. In order to change this, you have to make the following settings in the input dialog (click on
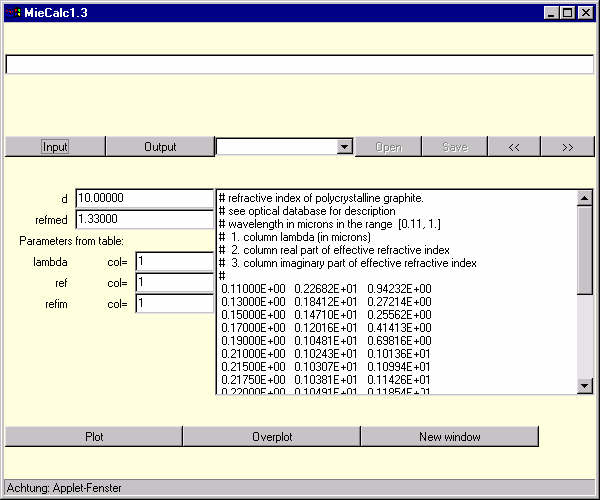
# refractive index of polycrystalline graphite.
# see optical database for description
# wavelength in microns in the range  [0.11, 1.]
#  1. column lambda (in microns)
#  2. column real part of effective refractive index
#  3. column imaginary part of effective refractive index
#
 0.11000E+00   0.22682E+01   0.94232E+00
 0.13000E+00   0.18412E+01   0.27214E+00
 0.15000E+00   0.14710E+01   0.25562E+00
 0.17000E+00   0.12016E+01   0.41413E+00
 0.19000E+00   0.10481E+01   0.69816E+00
 0.21000E+00   0.10243E+01   0.10136E+01
 0.21500E+00   0.10307E+01   0.10994E+01
 0.21750E+00   0.10381E+01   0.11426E+01
 0.22000E+00   0.10491E+01   0.11854E+01
 0.22500E+00   0.10759E+01   0.12700E+01
 0.24000E+00   0.12065E+01   0.15425E+01
 0.26000E+00   0.15673E+01   0.17973E+01
 0.30000E+00   0.22310E+01   0.16402E+01
 0.33000E+00   0.23895E+01   0.14357E+01
 0.40000E+00   0.25001E+01   0.12484E+01
 0.55000E+00   0.26095E+01   0.11063E+01
 0.70000E+00   0.26734E+01   0.11399E+01
 0.90000E+00   0.27938E+01   0.12310E+01
 0.11000E+01   0.29149E+01   0.13097E+01
 0.12500E+01   0.29950E+01   0.13607E+01
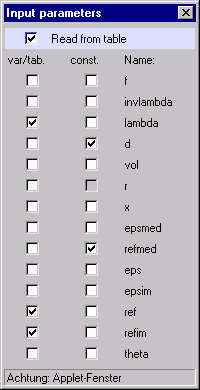
This tells the program that lambda, ref, and refim are to be read from the table (while d and refmed are being kept constant). Close the dialog. The main window will then look like this:
The number fields for the parameters lambda, ref and refim are used
to specify the column from which the data are to be read in. Choose
1, 2, 3, for the columns respectively. And set d = 0.01 for demonstration
purposes. In the output dialog, choose lambda as the abscissa and Qext
as the ordinate. Then click on ![]() to plot Qext(lambda). This results in the following plot:
to plot Qext(lambda). This results in the following plot:
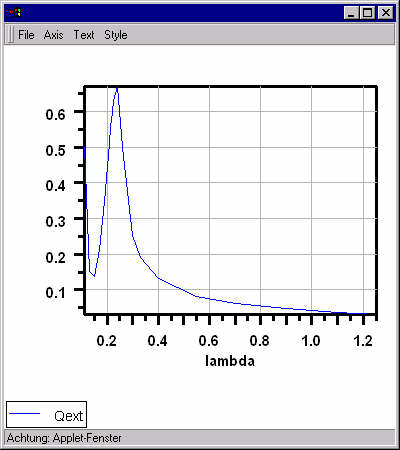
This plot shows the well-known UV-feature of graphitic particles. Instead
of doing all the work with the input/output dialogs, you can as well edit
the text in the text area, inserting the following lines in front
of the table:
d=0.01  refmed = 1.33
in =  {lambda, ref, refim}
out = {lambda, qext}
# refractive index of polycrystalline graphite.
# see optical database for description
# wavelength in microns in the range  [0.11, 1.]
#  1. column lambda (in microns)
#  2. column real part of effective refractive index
#  3. column imaginary part of effective refractive index
#
 0.11000E+00   0.22682E+01   0.94232E+00
 0.13000E+00   0.18412E+01   0.27214E+00
 0.15000E+00   0.14710E+01   0.25562E+00
 0.17000E+00   0.12016E+01   0.41413E+00
 0.19000E+00   0.10481E+01   0.69816E+00
 0.21000E+00   0.10243E+01   0.10136E+01
 0.21500E+00   0.10307E+01   0.10994E+01
 0.21750E+00   0.10381E+01   0.11426E+01
 0.22000E+00   0.10491E+01   0.11854E+01
 0.22500E+00   0.10759E+01   0.12700E+01
 0.24000E+00   0.12065E+01   0.15425E+01
 0.26000E+00   0.15673E+01   0.17973E+01
 0.30000E+00   0.22310E+01   0.16402E+01
 0.33000E+00   0.23895E+01   0.14357E+01
 0.40000E+00   0.25001E+01   0.12484E+01
 0.55000E+00   0.26095E+01   0.11063E+01
 0.70000E+00   0.26734E+01   0.11399E+01
 0.90000E+00   0.27938E+01   0.12310E+01
 0.11000E+01   0.29149E+01   0.13097E+01
 0.12500E+01   0.29950E+01   0.13607E+01
| CONTINUE >>>> |
|---|